Writing PDFs with Markdown
Using Pandoc to write PDFs in Markdown
Intro
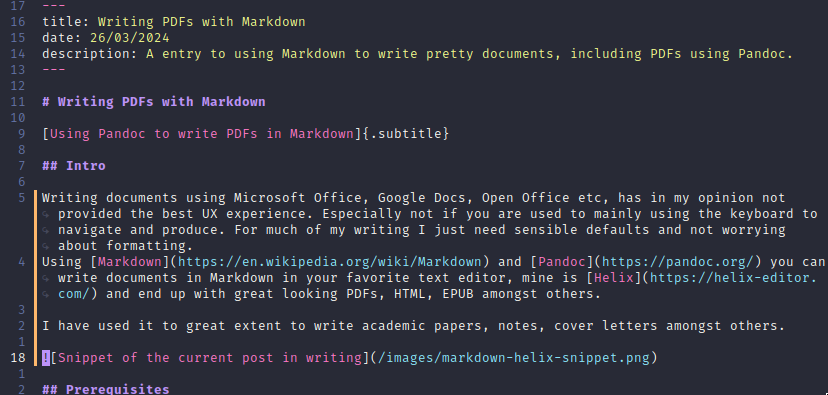
Writing documents using Microsoft Office, Google Docs, Open Office etc, has in my opinion not provided the best UX experience. Especially not if you are used to mainly using the keyboard to navigate and produce. For much of my writing I just need sensible defaults and not worrying about formatting. Using Markdown and Pandoc you can write documents in Markdown in your favorite text editor, mine is Helix and end up with great looking PDFs, HTML, EPUB amongst others.
I have used it to great extent to write academic papers, notes, cover letters amongst others. The image below is a snippet of this post when it was in writing.
Prerequisites
- Text editor of choice, prefferably with Markdown syntax support.
- Pandoc installed. Install on NixOS in shell with:
$ nix-shell -p pandoc texlive.combined.scheme-small
Usage
Write your content in a .md file, and when you are ready to create a PDF from your .md, then run:
$ pandoc your_document.md -o your_pdf.pdf
It will then parse the markdown and ouput a formatted PDF.
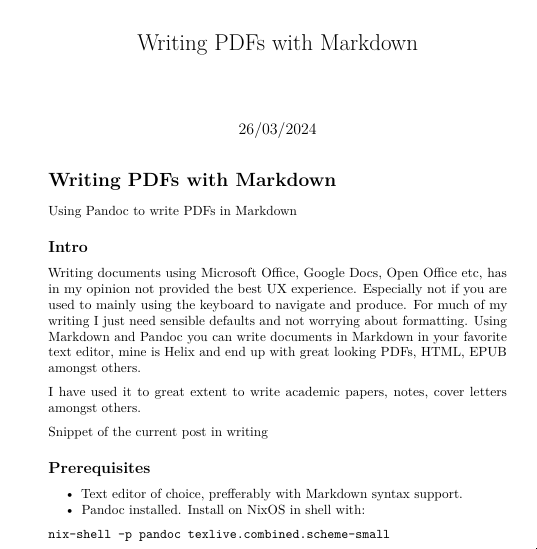
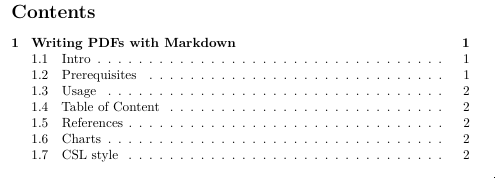
Table of Content
Adding a Table of Content is as simple as adding --toc to the command, you can also have the sections automatically numbered using --number-sections.
$ pandoc your_document.md -o your_pdf.pdf --toc --number-sections
References
Pandoc can also make handling references a breeze. Both footnotes, references to charts and images, as well as creating a reference sheet.
To do this you also need pandoc-crossref installed. To install with pandoc in shell on NixOS:
$ nix-shell -p pandoc texlive.combined.scheme-small haskellPackages.pandoc-crossref
To handle the references we need to create and specify a bibliography file, we do this by inserting bibliography: references.bib to the top of the file.
It will now look something like so:
---
title: your_title
date: 26/03/2024
bibliography: references.bib
---
The references.bib file being a standard BibTeX file, making it easy to import references. You can then cite from text by writing [@reference]
To generate the PDF with citations and references, run:
$ pandoc your_document.md -o your_pdf.pdf --toc --number-sections --filter pandoc-crossref --citeproc
It will both replace [@reference] with the information in the bibliography, as well as create a reference list at the end of the document.
Charts
Using pandoc-plot you can generate plots directly from your markdown code using Python, R, ect. To install with the other libraries run:
$ nix-shell -p pandoc texlive.combined.scheme-small haskellPackages.pandoc-crossref haskelPackages.pandoc-plot
You will also need a python environment with matplotlib and numpy to generate the plots in the following code.
You can then insert code like the following:
import json
import matplotlib.pyplot as plt

with open("sentiment_data.json") as file:
    data = json.load(file)

html_css_data = data["html_css_data"]
javascript_frontend_data = data["javascript_frontend_data"]
javascript_backend_data = data["javascript_backend_data"]
c_sharp_data = data["c_sharp_data"]
datalagring_data = data["datalagring_data"]
asp_net_data = data["asp_net_data"]

datasets = [
    ("HTML/CSS", html_css_data, "#1f77b4"),
    ("JavaScript Frontend", javascript_frontend_data, "#ff7f0e"),
    ("JavaScript Backend", javascript_backend_data, "#2ca02c"),
    ("C#", c_sharp_data, "#d62728"),
    ("Datalagring", datalagring_data, "#9467bd"),
    ("ASP.NET", asp_net_data, "#8c564b"),
]

fig, ax1 = plt.subplots(figsize=(10, 5))

for name, data, color in datasets:
    x = [d["x"] for d in data]
    y = [d["y"] for d in data]
    ax1.plot(x, y, marker="o", linestyle="-", color=color, label=name, alpha=0.7)
    ax1.plot(x, y, linestyle="-", color=color, alpha=0.3, linewidth=4)

ax1.set_xlabel("Week")
ax1.set_ylabel("Sentiment")
ax1.set_title("Sentiment over Time")
ax1.grid(True)
ax1.legend(loc="upper left")

plt.setp(ax1.get_xticklabels(), rotation=45, ha="right", rotation_mode="anchor")

plt.tight_layout()
And run with:
$ pandoc your_document.md -o your_pdf.pdf --toc --number-sections --filter pandoc-plot --filter pandoc-crossref --citeproc
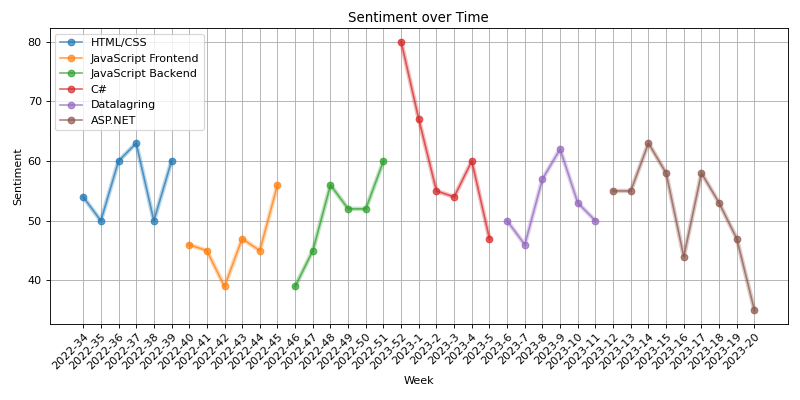
This code is from a recent project of mine. Which resulted in this plot:
CSL style
You can of course change the style of the citations generated. There is a large repository of styles availible. To use, download the .csl file and place it in the base directory, then you can run:
$ pandoc your_document.md -o your_pdf.pdf --toc --number-sections --csl="your_csl.csl" --filter pandoc-plot --filter pandoc-crossref --citeproc
Summary
The end result is a PDF that's nicely formatted, with a table of contents, citations, charts and a reference list.
I personally feel that I've just so far scratched the surface of what's possible to do with Pandoc. But so far I'm very satisfied, this abstracts away a lot of the unpleasurable things with writing.